
Súbor:20210822 Global warming - warming stripes bar chart.svg

Pôvodný súbor (SVG súbor, 1 000 × 750 pixelov, veľkosť súboru: 14 KB)
Zhrnutie
| Popis |
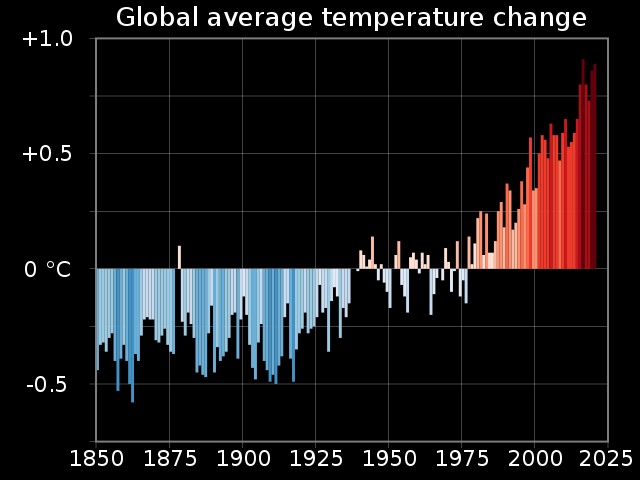
English: Vertical bar chart showing global average temperature change, with each bar/column being coloured according to the Warming stripes colouring scheme of Ed Hawkins (climatologist, who conceived the idea of warming stripes.
 Warming stripes (five examples compared) Warming stripes bar chart Bar chart (vertical) Pie chart Line charts Scatterplot I've uploaded .xlsx (Microsoft Excel) spreadsheets that automatically generate XML code for charts in SVG format. You simply paste or enter your data into the spreadsheet, and specify image dimensions, number of grid lines, font sizes, etc. The spreadsheet instantly and automatically generates a column of XML code that you simply copy and paste into a text editor and save as an ".svg" file. The spreadsheets produce lean SVG code, avoiding the "extra stuff" that Inkscape inserts. They should save you time in creating SVG charts. Feedback and suggestions on my talk page are welcome. RCraig09 (diskusia) 23:41, 19 February 2021 (UTC) Click HOW TO for detailed explanation.
Example SVG files: Category:SVG diagrams created with spreadsheet.
|
| Dátum | |
| Zdroj | Vlastné dielo |
| Autor | RCraig09 |
| SVG vývoj | Táto grafika bola vytvorená pomocou iných nástrojov. |


Licencovanie
- Môžete slobodne:
- zdieľať – kopírovať, šíriť a prenášať dielo
- meniť ho – upravovať dielo
- Za nasledovných podmienok:
- uvedenie autorov – Musíte spomenúť autorov (jednotlivo alebo kolektívne), poskytnúť odkaz na licenciu a uviesť, či ste niečo zmenili. Môžete to urobiť ľubovoľným primeraným spôsobom, ale nie spôsobom naznačujúcim, že poskytovateľ licencie podporuje vás alebo vaše použitie diela.
- meniť za rovnakých podmienok – Ak toto dielo zmeníte, prevediete do inej formy alebo použijete ako základ iného diela, musíte výsledok šíriť pod rovnakou alebo kompatibilnou licenciou ako originál.
História súboru
Po kliknutí na dátum/čas uvidíte ako súbor vyzeral vtedy.
| Dátum/Čas | Náhľad | Rozmery | Používateľ | Komentár | |
|---|---|---|---|---|---|
| aktuálna | 20:41, 8. august 2022 | | 1 000 × 750 (14 KB) | Sebastian Wallroth | File uploaded using svgtranslate tool (https://svgtranslate.toolforge.org/). Added translation for de. |
| 20:28, 23. august 2021 |  | 1 000 × 750 (12 KB) | RCraig09 | Version 2: narrowing vertical scale so trace occupies more of image | |
| 04:03, 23. august 2021 |  | 1 000 × 750 (13 KB) | RCraig09 | Uploaded own work with UploadWizard |
Použitie súboru
Žiadne stránky neobsahujú odkazy na tento súbor.
Globálne využitie súborov
Nasledovné ďalšie wiki používajú tento súbor:
- Použitie na en.wikipedia.org
- Talk:SVG
- Wikipedia:SVG help
- Talk:Data and information visualization
- User talk:RCraig09
- Warming stripes
- Talk:Warming stripes
- Wikipedia talk:WikiProject Countries/Archive 13
- Wikipedia talk:WikiProject Climate change/Archive 2
- Talk:Climate change/Archive 86
- User:RCraig09/Excel to XML for SVG
- User talk:RCraig09/Archive 2 (2020)
- Wikipedia:Graphics Lab/Illustration workshop/Archive/Apr 2021
- Passive daytime radiative cooling
- User talk:RCraig09/Archive 3 (2021-2022)
- User talk:RCraig09/Archive 4 (2023)
- Použitie na gl.wikipedia.org
- Použitie na he.wikipedia.org